д»ҠеӨ©жҷҡдёҠеӯҰд№ дәҶдёӢдҪҝз”ЁpychaжЁЎеқ—жқҘеҲ¶дҪңеҗ„з§ҚеҠһе…¬з”Ёеӣҫзҡ„ж–№жі•пјҢйқһеёёз®ҖеҚ•пјҢжң¬ж–ҮдҪҝз”Ёе…¶з»ҳеҲ¶дәҶ7з§ҚеӣҫиЎЁгҖӮ
В жӯӨжЁЎеқ—е’ҢAPIең°еқҖдёәпјҡhttp://www.lorenzogil.com/projects/pycha/пјҢйңҖиҰҒзҡ„жңӢеҸӢеҸҜд»ҘдёӢиҪҪдёӢжқҘзҺ©дёҖдёӢпјҢдёӢйқўжҳҜжҲ‘жҷҡдёҠеӯҰд№ ж—¶еҶҷзҡ„дёҖзӮ№дёңдёңпјҢеҲҶдә«д№ӢгҖӮ
дёҖгҖҒд»Јз Ғпјҡ
#!/usr/bin/env python
# -*- coding: utf-8 -*-
import cairo
import pycha.pie
import pycha.bar
import pycha.scatter
import pycha.stackedbar
import pycha.line
#и®ҫзҪ®з”»еёғ
def set_charvalue():
width,height=600,600
surface=cairo.ImageSurface(cairo.FORMAT_ARGB32,width,height)
return surface
#з”»йҘјеӣҫ
def draw_pie(surface, options, dataSet):
chart=pycha.pie.PieChart(surface,options)
chart.addDataset(dataSet)
chart.render()
surface.write_to_png("d:Pie.png")
#еһӮзӣҙзӣҙж–№еӣҫ
def draw_vertical_bar(surface, options, dataSet):
chart=pycha.bar.VerticalBarChart(surface,options)
chart.addDataset(dataSet)
chart.render()
surface.write_to_png("d:vertical_bar.png")
#еһӮзӣҙж°ҙе№ізӣҙж–№еӣҫ
def draw_horizontal_bar(surface, options, dataSet):
chart = pycha.bar.HorizontalBarChart(surface,options)
chart.addDataset(dataSet)
chart.render()
surface.write_to_png("d:horizontal_bar.png")
#зәҝеӣҫ
def draw_line(surface, options, dataSet):
chart = pycha.line.LineChart(surface,options)
chart.addDataset(dataSet)
chart.render()
surface.write_to_png("d:line.png")
#зӮ№еӣҫ
def draw_scatterplot(surface, options, dataSet):
chart = pycha.scatter.ScatterplotChart(surface,options)
chart.addDataset(dataSet)
chart.render()
surface.write_to_png("d:scatterplotChart.png")
#еһӮзӣҙеқ—еӣҫ
def draw_stackedverticalbarChar(surface, options, dataSet):
chart = pycha.stackedbar.StackedVerticalBarChart(surface,options)
chart.addDataset(dataSet)
chart.render()
surface.write_to_png("d:stackedVerticalBarChart.png")
#ж°ҙе№іеқ—еӣҫ
def draw_stackedhorizontalbarChart(surface, options, dataSet):
chart = pycha.stackedbar.StackedHorizontalBarChart(surface,options)
chart.addDataset(dataSet)
chart.render()
surface.write_to_png("d:stackedhorizontalbarChart.png")
if __name__ == "__main__":
"""
Function:дҪҝз”Ёpychaз”»еҗ„з§ҚеӣҫиЎЁ
InputпјҡNONE
Output: NONE
author: socrates
blog:http://blog.csdn.net/dyx1024
date:2012-02-28
"""
#ж•°жҚ®жқҘжәҗ
dataSet=(
("iphone",((0,1),(1,3),(2,2.5))),
("htc",((0,2),(1,4),(2,3))),
("hw",((0,5),(1,1,),(2,0.5))),
("zte",((0,3),(1,2,),(2,1.5))),
)
#еӣҫеғҸеұһжҖ§е®ҡд№ү
options={
"legend":{"hide":False},
"title":"жүӢжңәй”Җе”®йҮҸеҲҶеёғеӣҫ(by dyx1024)",
"titleColor":"#0000ff",
"titleFont":"еӯ—дҪ“",
"background":{"chartColor": "#ffffff"},
"axis":{"labelColor":"#ff0000"},
}
surface = set_charvalue()
#ж №жҚ®йңҖиҰҒи°ғз”ЁдёҚеҗҢеҮҪж•°з”»дёҚеҗҢеҪўзҠ¶зҡ„еӣҫ
#draw_pie(surface, options, dataSet)
#draw_vertical_bar(surface, options, dataSet)
#draw_horizontal_bar(surface, options, dataSet)
#draw_scatterplot(surface, options, dataSet)
#draw_stackedverticalbarChar(surface, options, dataSet)
#draw_stackedhorizontalbarChart(surface, options, dataSet)
draw_line(surface, options, dataSet)
дәҢгҖҒжөӢиҜ•пјҡ
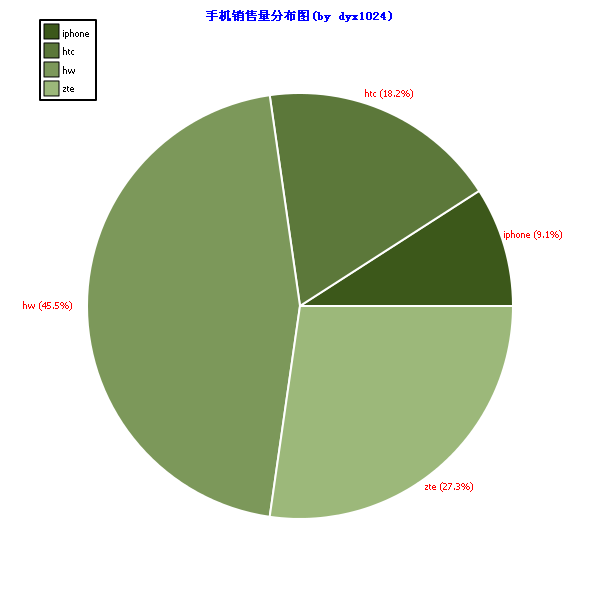
1гҖҒеҮҪж•°draw_pie(surface, options, dataSet)пјҡ
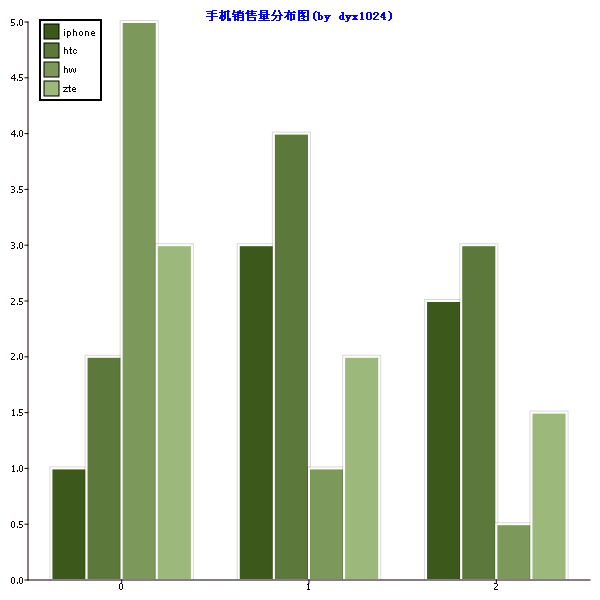
2гҖҒеҮҪж•°draw_vertical_bar(surface, options, dataSet)пјҡ
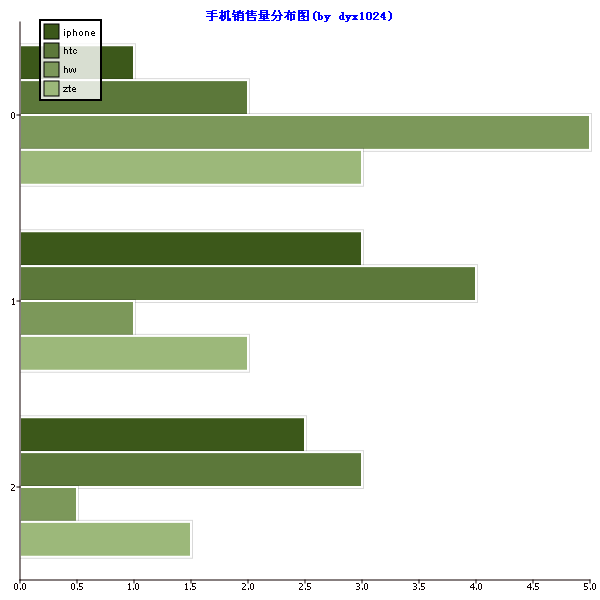
3гҖҒеҮҪж•°draw_horizontal_bar(surface, options, dataSet)пјҡ
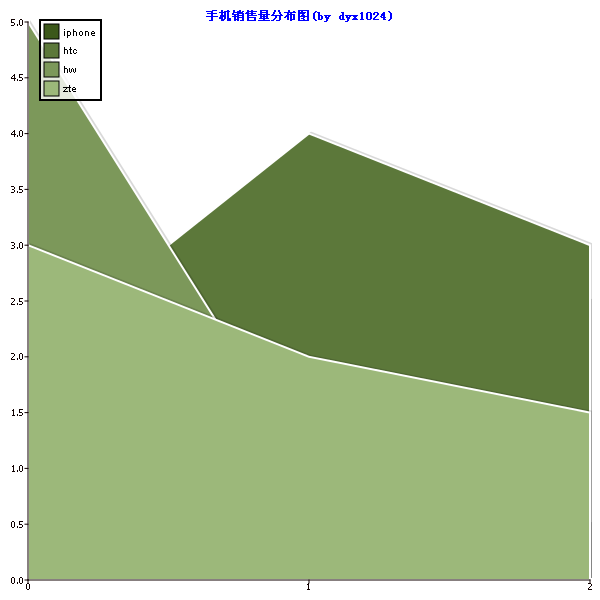
4гҖҒеҮҪж•°draw_line(surface, options, dataSet):
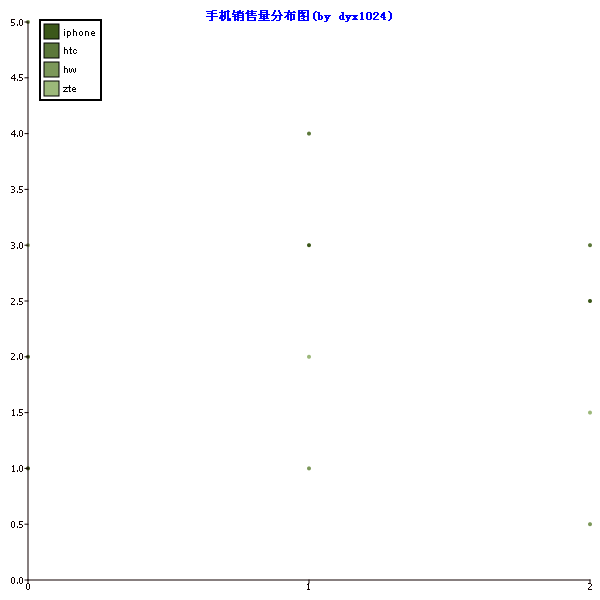
5гҖҒеҮҪж•°draw_scatterplot(surface, options, dataSet)пјҡ
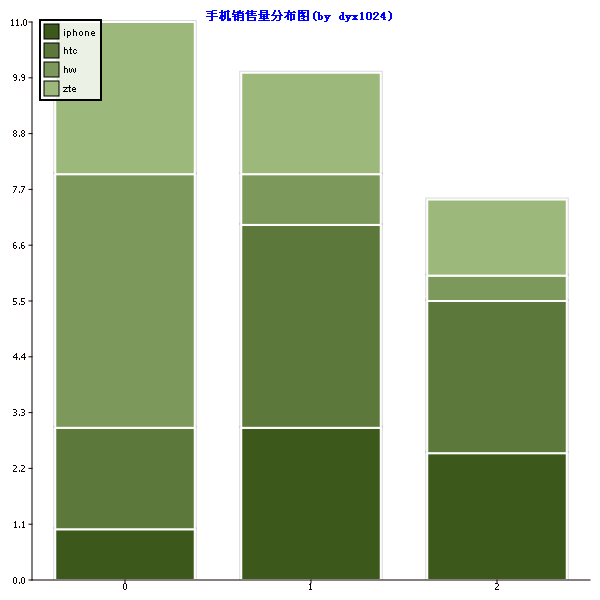
6гҖҒеҮҪж•°draw_stackedverticalbarChar(surface, options, dataSet)пјҡ
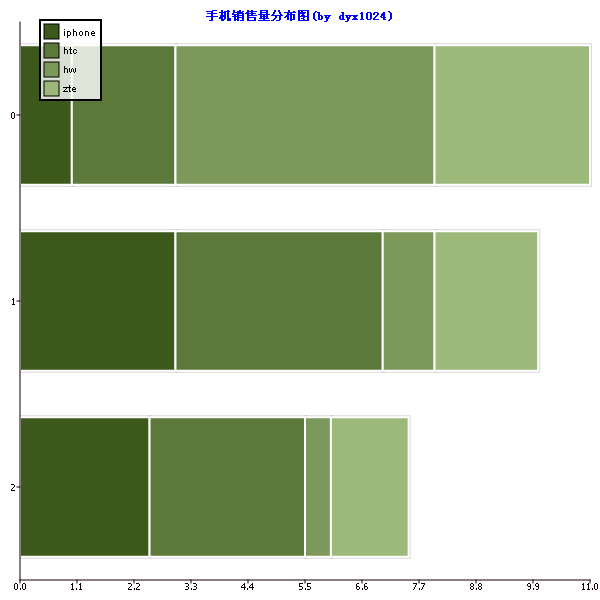
7гҖҒеҮҪж•°draw_stackedhorizontalbarChart(surface, options, dataSet)пјҡ